Mateo Gavilanes1 & Alexia Rosero1
Escuela de Ciencias Químicas e Ingeniería, Laboratorio de Química, Yachay Tech University, 100119 Urcuquí, Ecuador
2023

Esta obra está bajo una Licencia Creative Commons Atribución-CompartirIgual 4.0 Internacional.
Abstract
This experiment is focused on solving three main questions. Are the densities of Coke and Diet Coke different? Carbonate beverages, are widely consumed worldwide. With the experiment we have verified that Coke is denser than Diet coke due to the additional sugar it has. The second question is, which is the most accurate glassware material? Studying the density of the two samples in different materials, it has been determined that the volumetric pipette is more accurate for this type of measurements. And the last question, does the size of the sample affect the density? Thanks to the existing precision, it has been verified that density is an intensive property being independent of the amount of mass of the sample.
KEY WORDS: Density, soft drinks, laboratory glassware, calibration curve
Introduction
The density (ρ) is a scalar quantity that allows to know the amount of mass of a substance contained in a certain volume. The density of a liquid is measured by the mass of the liquid divided by its volume (D=m/v). According to the American Chemical Society (ACS), just like solids, liquids have their own characteristic density. Since the molecules that make up a liquid have a certain size, mass, and attraction for each other, it makes sense that each liquid has a certain mass for a given volume, giving it a unique density. 1
At the laboratory, density could be measured directly or indirectly. The most common way is based on the measurement of the mass (using a balance) contained in a volumetric material of known volume. Considering this data, it is possible to analyze the relative standard deviation (DER) in order to identify the best glassware. With this previous knowledge, we are able to determinate the density of two commercial soft drinks: Diet Coke and Coke.
Materials and Methods
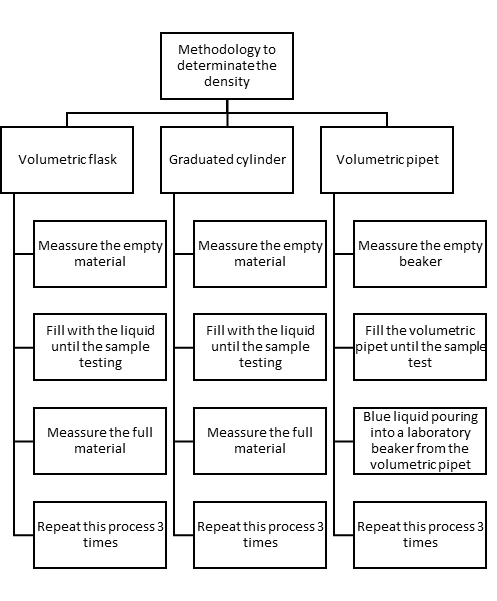
First of all, we need to have the two samples: A and B, one corresponds to Diet Coke and another one is Coke. Also, we will use three types of volumetric material: volumetric flaks, graduated cylinder and volumetric pipet. This experiment is divided into three parts. In the first experience, we determinate the mass of the soft drinks contained in the three
volumetric materials. Then, we have to measure the empty volumetric material in the electronic balance and after that, we can measure with the sample inside. In the case of pipettes, once they are filled, we have to empty them in a beaker to make the corresponding measurements.
With this data, we can continue with the second part. The data are used to compare the accuracy and precision of different types of glassware and to determine which of the samples is denser. It is possible to know thanks to the relative standard deviation (DER). About data-pooling experiments Herrick et al. (1999) mention the most important advantage is the creation, in a single laboratory period, of a database that allows the student researchers to examine different aspects of the experiment. 2
Finally, the third part consists in demonstrate the density as an intensive property. That means, density does not depend of the quantity of substance. Sebastian G. Canagaratna poses an example:
Does it make sense to talk of the property without specifying the size of the system?» We speak. for example. of the density of water at a certain temperature and pressure, not of the density of 10 g of water or the density of 20 g of water. This shows that density is an intensive property. 3
To demonstrate this, we use the material selected in experience two to compare with materials of different volume.
Results and Discussion
Experience 1. Estimation of the density of soft drinks using different volumetric materials.
The table 1 shows the mass of soft drinks contained in different volumetric materials of known volume:
| Density 50 (g/mL) | ||
| Material | Sample A | Sample B |
| Volumetric flask | 1.02 g/mL | 1 g/mL |
| 1.02 g/mL | 1 g/mL | |
| 1.02 g/mL | 1 g/mL | |
| Graduated cylinder | 1.02 g/mL | 1 g/mL |
| 1.02 g/mL | 1 g/mL | |
| 1.02 g/mL | 1 g/mL | |
| Volumetric pipet | 0.98 g/mL | 1 g/mL |
| 1.03 g/mL | 1 g/mL | |
| 1.08 g/mL | 0.99 g/mL | |
Next, figure 1 shows dispersion of densities between samples A and B.
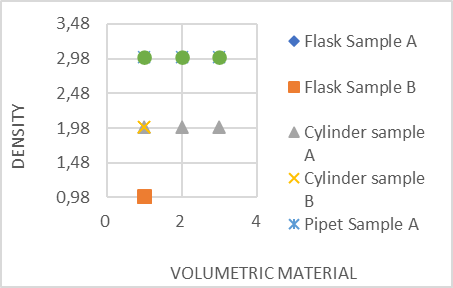
Figure 1 shows that there is no dispersion between the data. This represents that there is a very close relationship between sample A and sample B.
Experience 2. Selection of volumetric material with greater precision for density estimation.
| Material | Average density (g/mL) | Desv. Est. (g/mL) | %DER | |
| Graduated flask | Sample A | 1.02 | 0 | 0% |
| Sample B | 1 | 0 | 0% | |
| Graduated test tube | Sample A | 1.02 | 0 | 0% |
| Sample B | 1 | 0 | 0% | |
| Graduated pipette | Sample A | 1.02 | 0.05 | 5% |
| Sample B | 1 | 0 | 1% | |
According to the data, the most accurate glassware material is the volumetric pipet. The volumetric pipet presents a higher difference in the calculation of relative standard deviation (RSD). Therefore, we observe that sample A has a higher density than sample B.
Accurace analysis
Taking as true values what was reported by Herrick et al. (1999) determine to which drink the samples A and B correspond.
Sample A: Coke
Sample B: Diet Coke
What is the reason for the difference in the density values of carbonated drinks?
The difference in densities is due to the sucrose present in the original coke. This additional sweetener influences the density of the coke, denoting that the sample that has the highest density is A.
However, it does not mean that diet coke is better than normal coke. It has disadvantages for health. Even Katherine L Tucker et.al (2006), mention:
In addition to the displacement of more nutrient-dense beverages, there are several reasons to hypothesize that carbonated soft drinks, and colas in particular, may be associated with lower BMD (bone mineral density). Caffeine is an ingredient in most colas and has been identified as a risk factor for osteoporosis. Furthermore, colas contain phosphoric acid, which was shown to interfere with calcium absorption and to contribute to imbalances that lead to additional loss of calcium. It has also been suggested that the high fructose corn syrup used to sweeten carbonated beverages may negatively affect bone. 4
Analysis of the Suggar content in soft drinks
Data
- Water density: 0,998207 g/mL
- Saccharose density: 1,587 g/mL
- Ideal solution:

Sample A:1,34 (%m/m).
Sample B: 0.018 (%m/m).
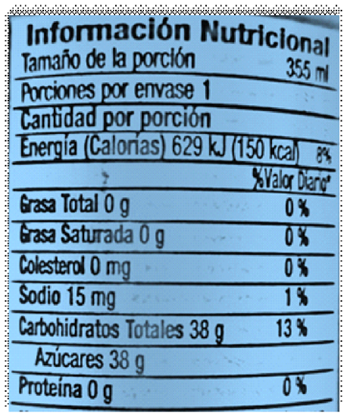
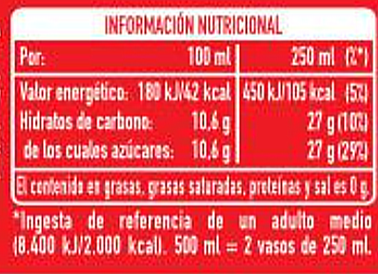
Based on the nutritional information of our sample and comparing it with a generic drink that can be obtained in any supermarket, we determined that the percentage present in sample A is 1.34 (%m/m) and sample B 0.018 (%m/m).
Comparing the sample data with the generic drink we can say that there are 27g of sucrose per 250 ml being equivalent to 10.8%.
Experience 3. Experimental demonstration of density as an intensive property.
Figure 3 represents the density as an intensive property since it does not show a variation independently of the mass of the sample.
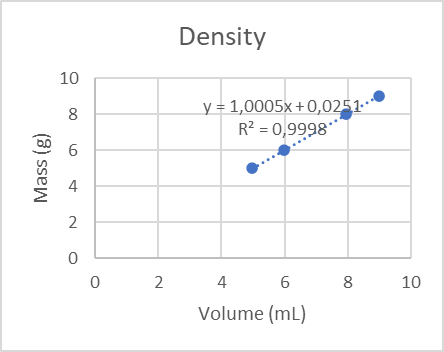
The slope value represents the density. The regression analysis R² = 0.9998 ≈ 1 present in the graph represents a perfect fit and therefore a reliable model of accuracy. In this case, it denotes the accuracy of the sample measurement.
The density is considered an intensive property since regardless of the mass will not change this value, an example is the water that presents a fixed density, since we can determine a liquid just by knowing its density, we can also determine that based on this slope there will be a noticeable difference in the precision of each volumetric material and the difference in density existing in each of the samples.
Conclusions
In conclusion, the most accurate glassware material is the volumetric pipet. Basing on the standard deviation graph present in the different densities of samples A and B we can say that the volumetric material with the highest precision is the volumetric pipette and can show the notorious difference in densities between each of these, thus being the most viable when making this type of measurements.
Also, the Coke is the densest drink. The reason why Coke is denser is that it has sugar and Diet Coke does not. Diet Coke is composed by Aspartame, water and caramel color. On the other hand, Coke has fructose in big quantities. However, we have already mentioned that both are harmful to health and may present long-term problems.
Finally, density is an intensive property. We have demonstrated that density does not depend of the quantity of matter.
References List
- American Chemical Society. Density of Liquids. https://www.acs.org/content/dam/acsorg/education/k-8/inquiry-in-action/fifth-grade/g5-l2.2-identifying-unknown-liquid.pdf (accessed 2023-06-07).
- Herrick, R. S.; Nestor, L. P.; Benedetto, D. A. Using Data Pooling to Measure the Density of Sodas: An Introductory Discovery Experiment. Journal of Chemical Education 1999, 76 (10), 1411. DOI:10.1021/ed076p1411.
- Canagaratna, S. Intensive and Extensive Properties 1992, 957–958. https://pubs.acs.org/doi/abs/10.1021/ed069p957.
- Tucker, K. L.; Morita, K.; Qiao, N.; Hannan, M. T.; Cupples, L. A.; Kiel, D. P. Colas, but Not Other Carbonated Beverages, Are Associated with Low Bone Mineral Density in Older Women: The Framingham Osteoporosis Study. The American Journal of Clinical Nutrition 2006, 84 (4), 936–942. DOI:10.1093/ajcn/84.4.936.
Visitas: 0


































Deja una respuesta
Lo siento, debes estar conectado para publicar un comentario.